Introducing SOURCE
a New Tool to Track Funding from Private Foundations to American Higher Ed
By Tao Tan
June 24, 2026
The debate about private money in higher education is loud, emotion-laden, and not typically backed by sufficient evidence. Up to this point, access to the evidence has been challenging, since it sits in millions of separate tax filings that few people have read and even fewer have systematically analyzed. Today, the Center for the Future of the American University at the American Enterprise Institute is pleased to announce the release of a browser we have developed to help researchers, journalists, academic leaders and the general public to more easily view this information. The portal is called SOURCE (the Searchable Open University Records of Charitable Expenditures).
Why Source?
In January, I published research showing that a small stream of private money shapes academic culture in the humanities, arts, and social sciences. That analysis rested on a single year of tax filings (2023), and the problem was obvious: one year is just a snapshot in time, and a snapshot can mislead. SOURCE is a tool that draws on fifteen years of data.
The raw material from which SOURCE draws comes from Form 990-PF, the annual return that private foundations file with the IRS. SOURCE looks at Form 990 filings from 2008 to 2025, giving insight into nearly 1.1 million grants, collectively worth over $90 billion, from over 57,000 private foundations to nearly 5,300 colleges and universities. (It is important to note that the data set is robust only from 2020 onwards, since that was when the IRS began mandating e-filing tax returns.) With the assistance of a large language model, SOURCE classifies each of these grants by one or more topical “tags” (research, financial aid, STEM, etc.). The approach to classification is published at the bottom of the browser page, and the line item links each grant to the original IRS filing, so other researchers can proof the classification system.
What SOURCE captures: SOURCE gives insight only into private foundation giving, which represents roughly half of all private giving to universities. (The remainder of private giving comes from individuals, private companies including LLCs, and foreign sources, none of which are required to file a 990-PF). It is worth keeping in mind that foundation giving is a small part of how universities are funded. For example, the federal government spends $57 billion a year on scientific research, which is about 16 times what foundations give to this area. However, where federal money is insufficient to structurally sustain a field, as in the humanities, arts, and social sciences, the marginal foundation dollar competes with very little, and therefore can wield disproportionate influence.
What does this corpus of data tell us? The initial findings sort into four themes.
Concentration, all the way down
The defining feature of private giving to higher education is concentration, and it appears at every level of who gives, who receives, and what gets funded.
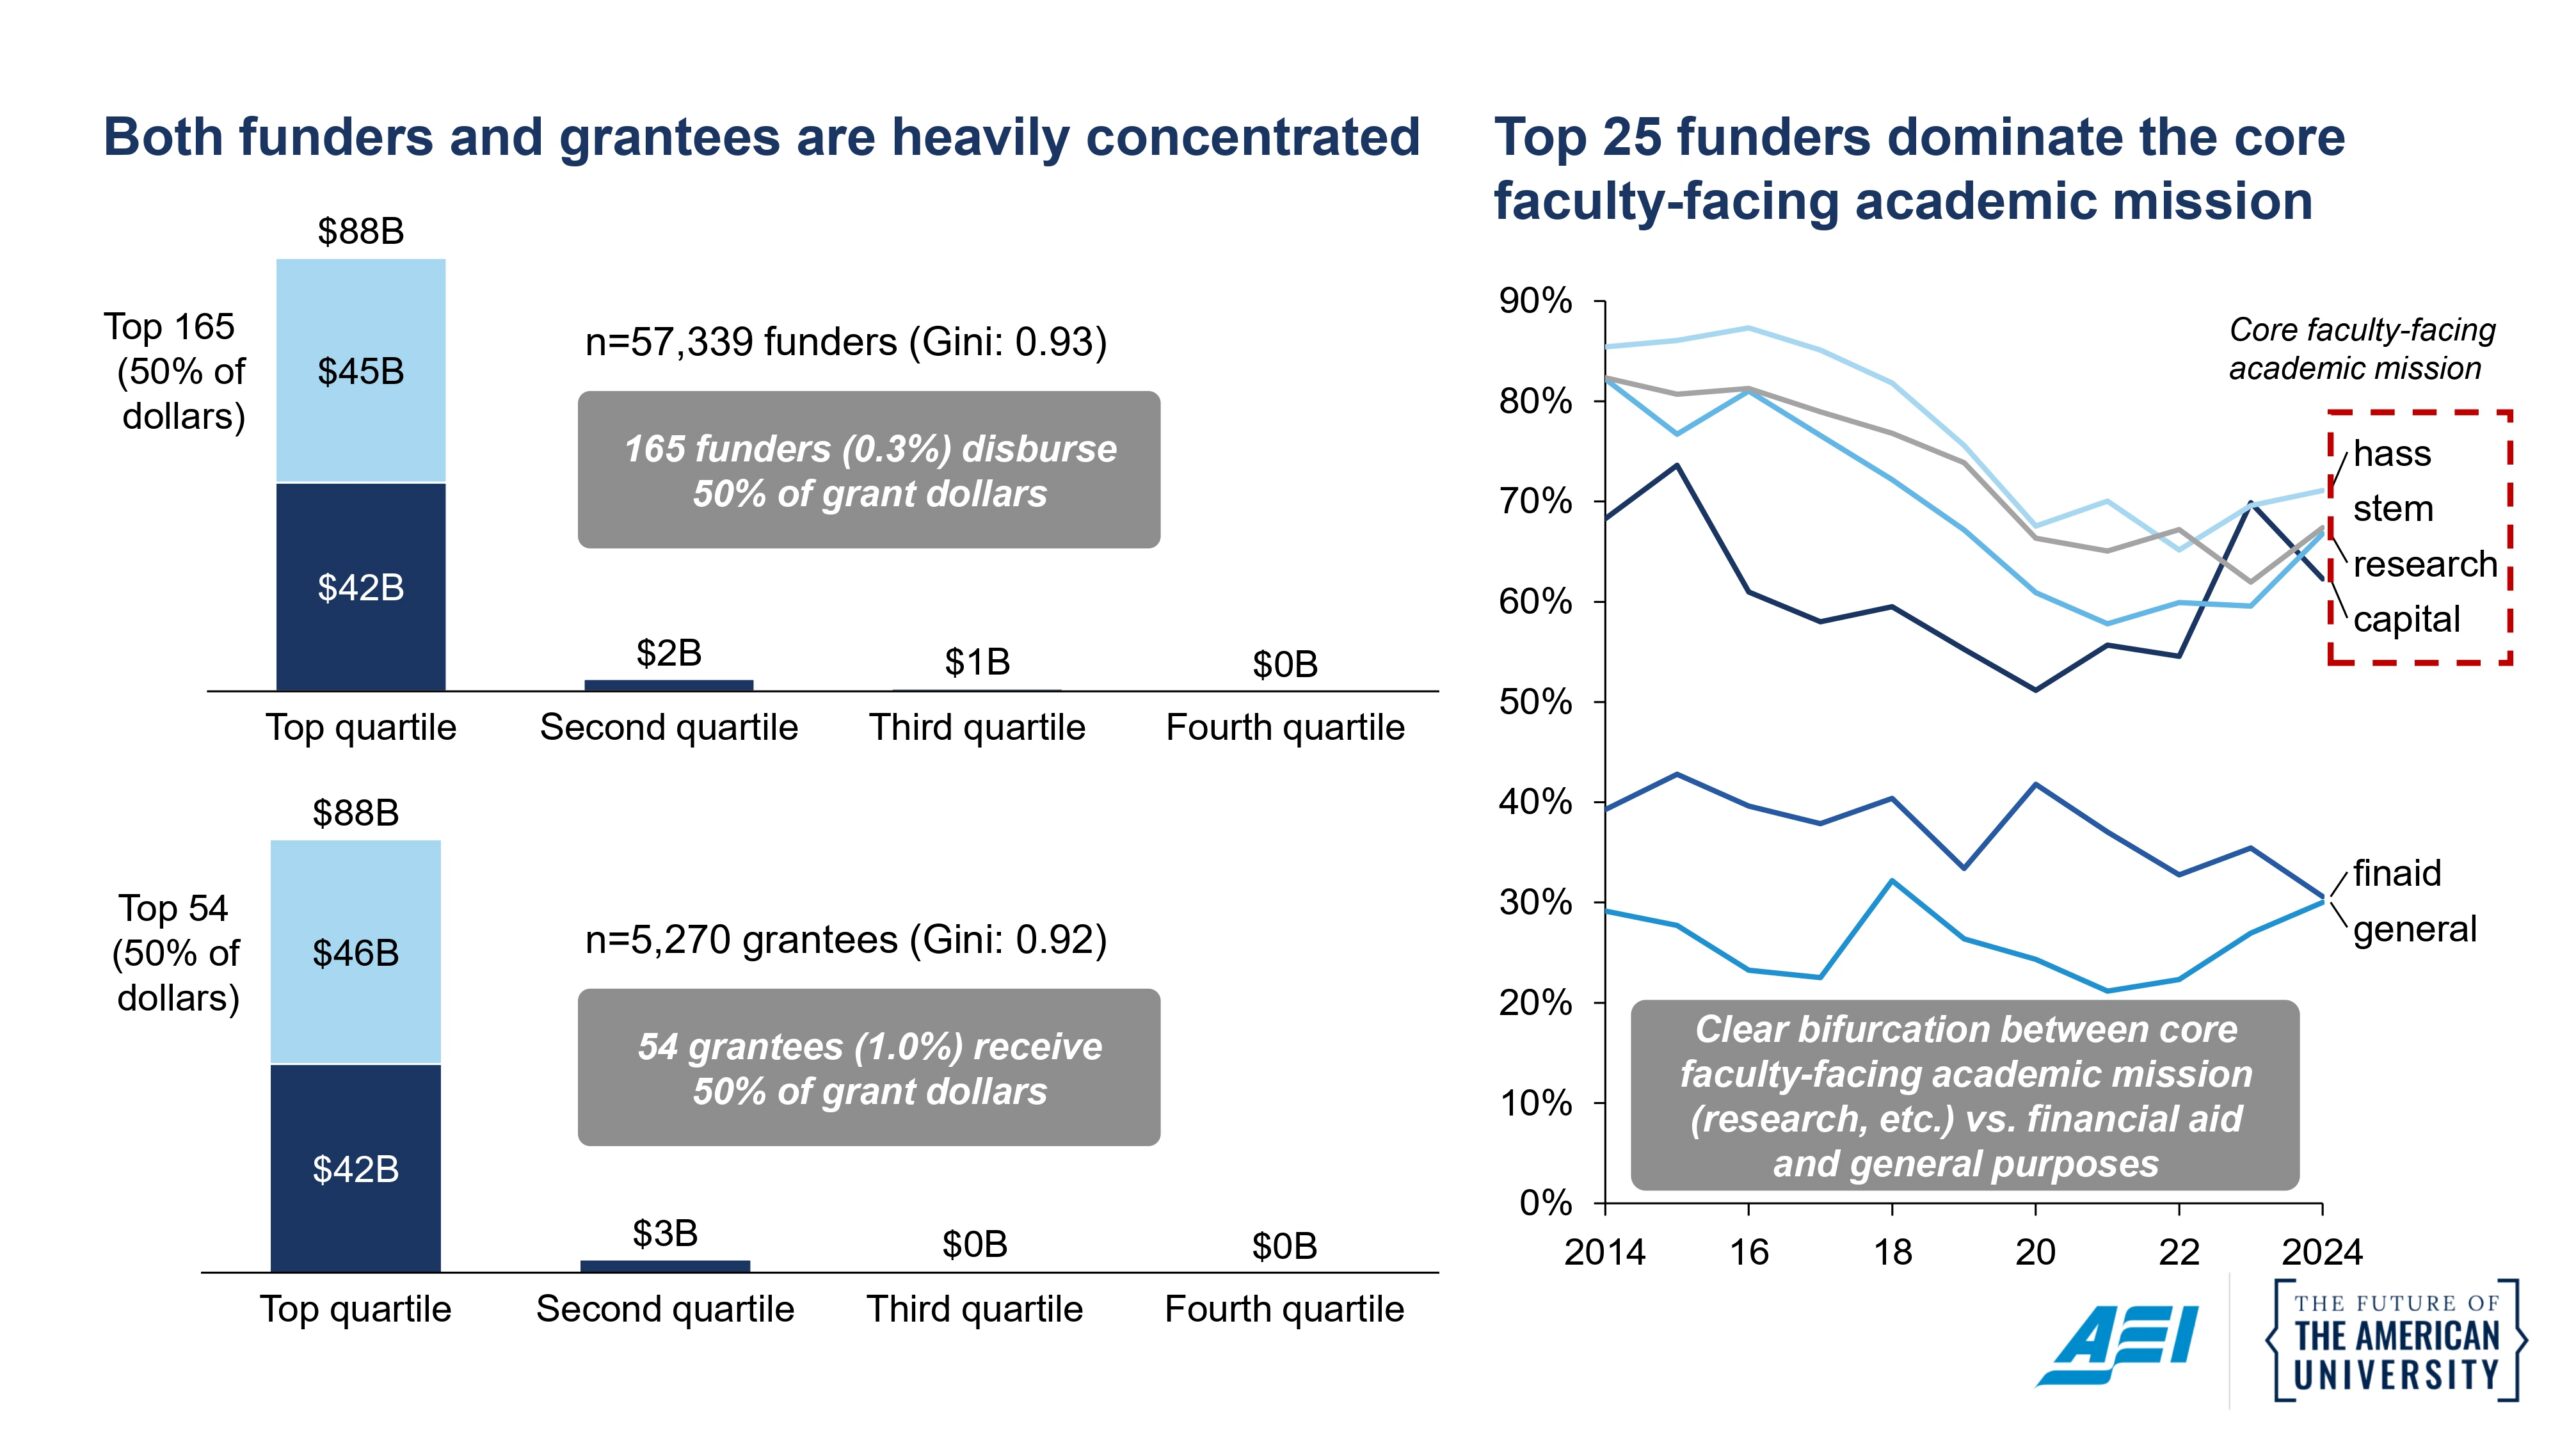
Start with the funders. Of the 57,339 foundations in the file, 165 supply half of all the dollars. Since 2010, the Gates Foundation alone gave a staggering $9.1 billion, close to one dollar in every ten, and more than the next six largest foundations combined.
The receiving end mirrors the giving end. Of the 5,270 institutions that received grants, 54, almost exactly 1%, received half the money, topped by Harvard, Stanford, and Johns Hopkins, each of which received over $2.5 billion. The 526 community colleges in our data set received only $1.3 billion combined, considerably less than the amount given to any one of the top three schools. Private philanthropy intensifies rather than flattens the prestige hierarchy of American higher education.
Funding for disciplines is also concentrated. Grants that touch the core faculty-facing academic mission (research, capital projects, specific disciplines) show the top 25 funders disbursing 70% or more of their spend. By contrast, non-faculty-facing topics such as financial aid or general purposes had the top 25 foundations controlling only around 30% of their spend.
Some recipients are uniquely concentrated. 66% of foundation dollars the University of Washington has raised in fifteen years came from the Gates Foundation. Bloomberg underwrote 38% of the foundation money reaching Johns Hopkins. The two Open Society foundations provided 51% of foundation funding to Bard College. And the most remarkable example: the University of Oregon received a staggering 86% of its foundation funding from the Knight Foundation (affiliated with Phil Knight, the co-founder of Nike, and not the similarly named John S. and James L. Knight Foundation).
Two kinds of patron, and the checks keep growing
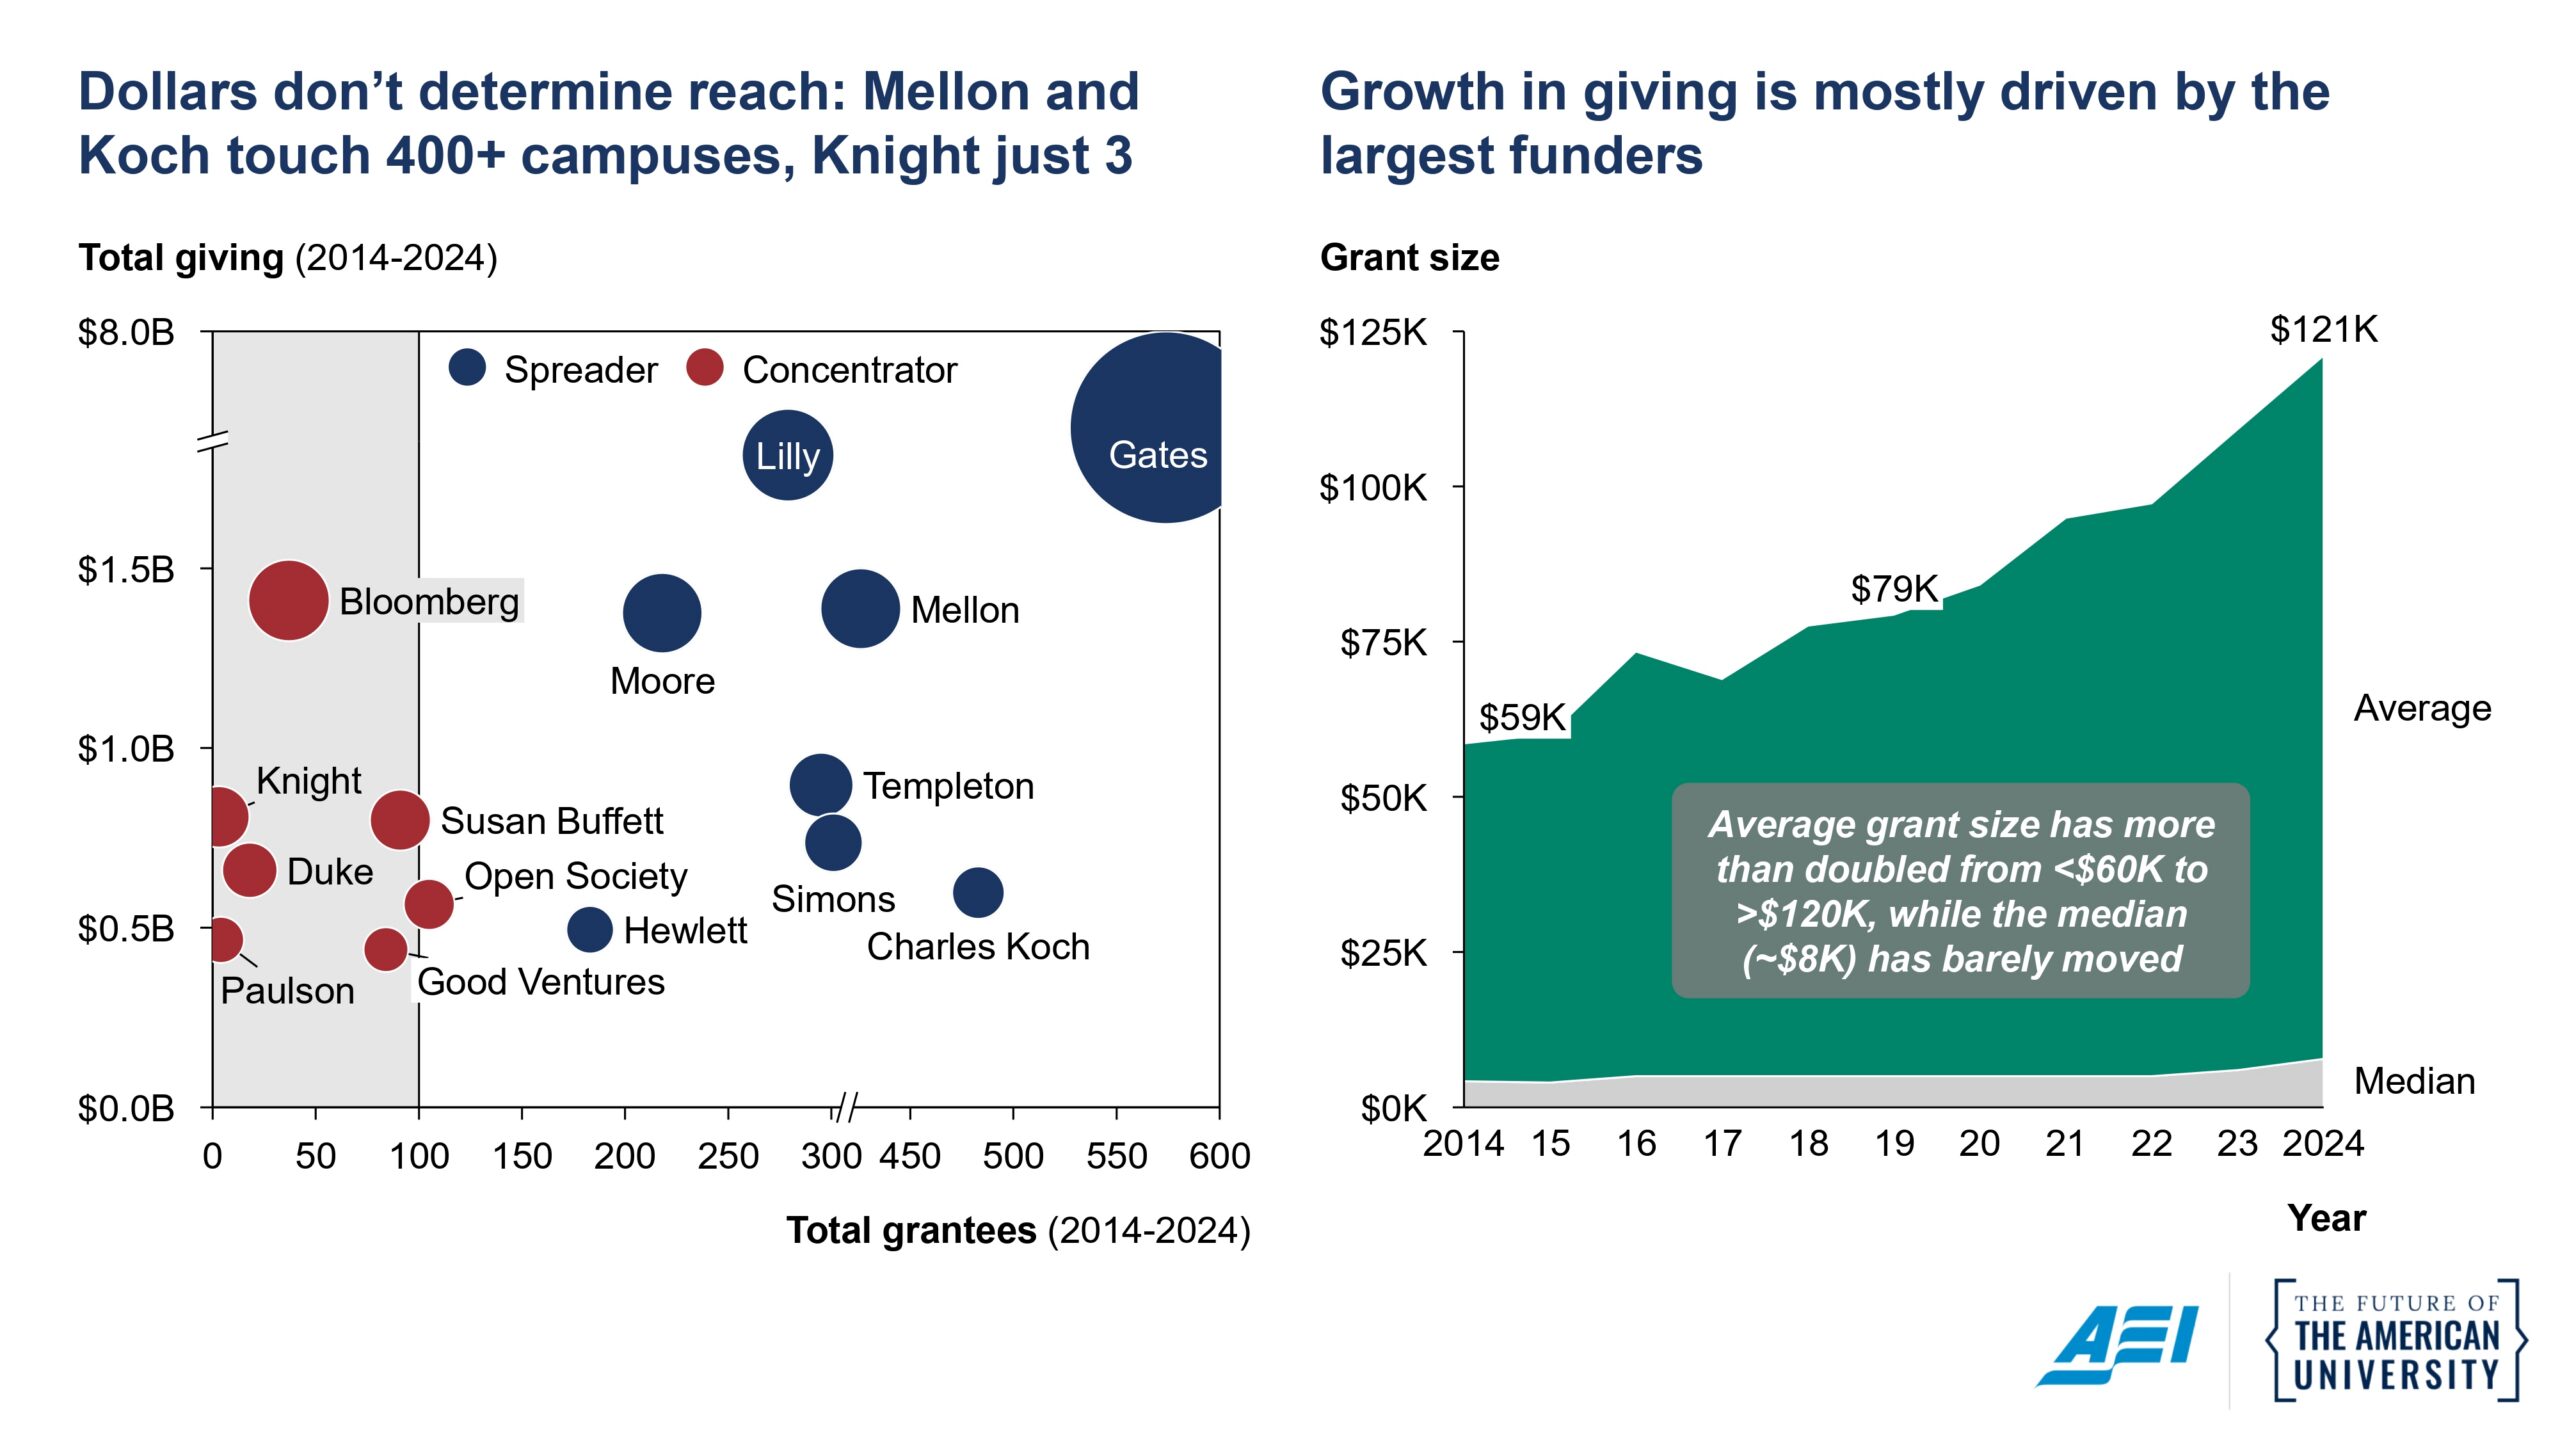
The largest funders seem to follow two distinct strategies. One is the “spreader”: the social justice-focused Mellon Foundation seeded 426 campuses with an average grant of $580,000 since 2016; the classical liberalism-supporting Charles Koch Foundation reached 430 with an average grant of $350,000 over the same period. The other is the “concentrator”: Bloomberg’s $1.4 billion went to 37 schools, over 70% of it to Hopkins; the Duke Endowment funded 18; Knight put $850 million into three.
The checks are also growing, but only at the top. The median grant in the database is $5,000, and has barely moved in a decade. Meanwhile, the mean grant more than doubled in size over the same period, from under $60,000 in 2014 to over $120,000 in 2024. Nearly all of the increase happened in large gifts clustered at the top. Nine-figure single gifts, once a rare event, showed up four times in both 2023 and 2024. The growth in foundation giving is more of a steepening spike than a rising tide.
The size of a grant correlates to its purpose
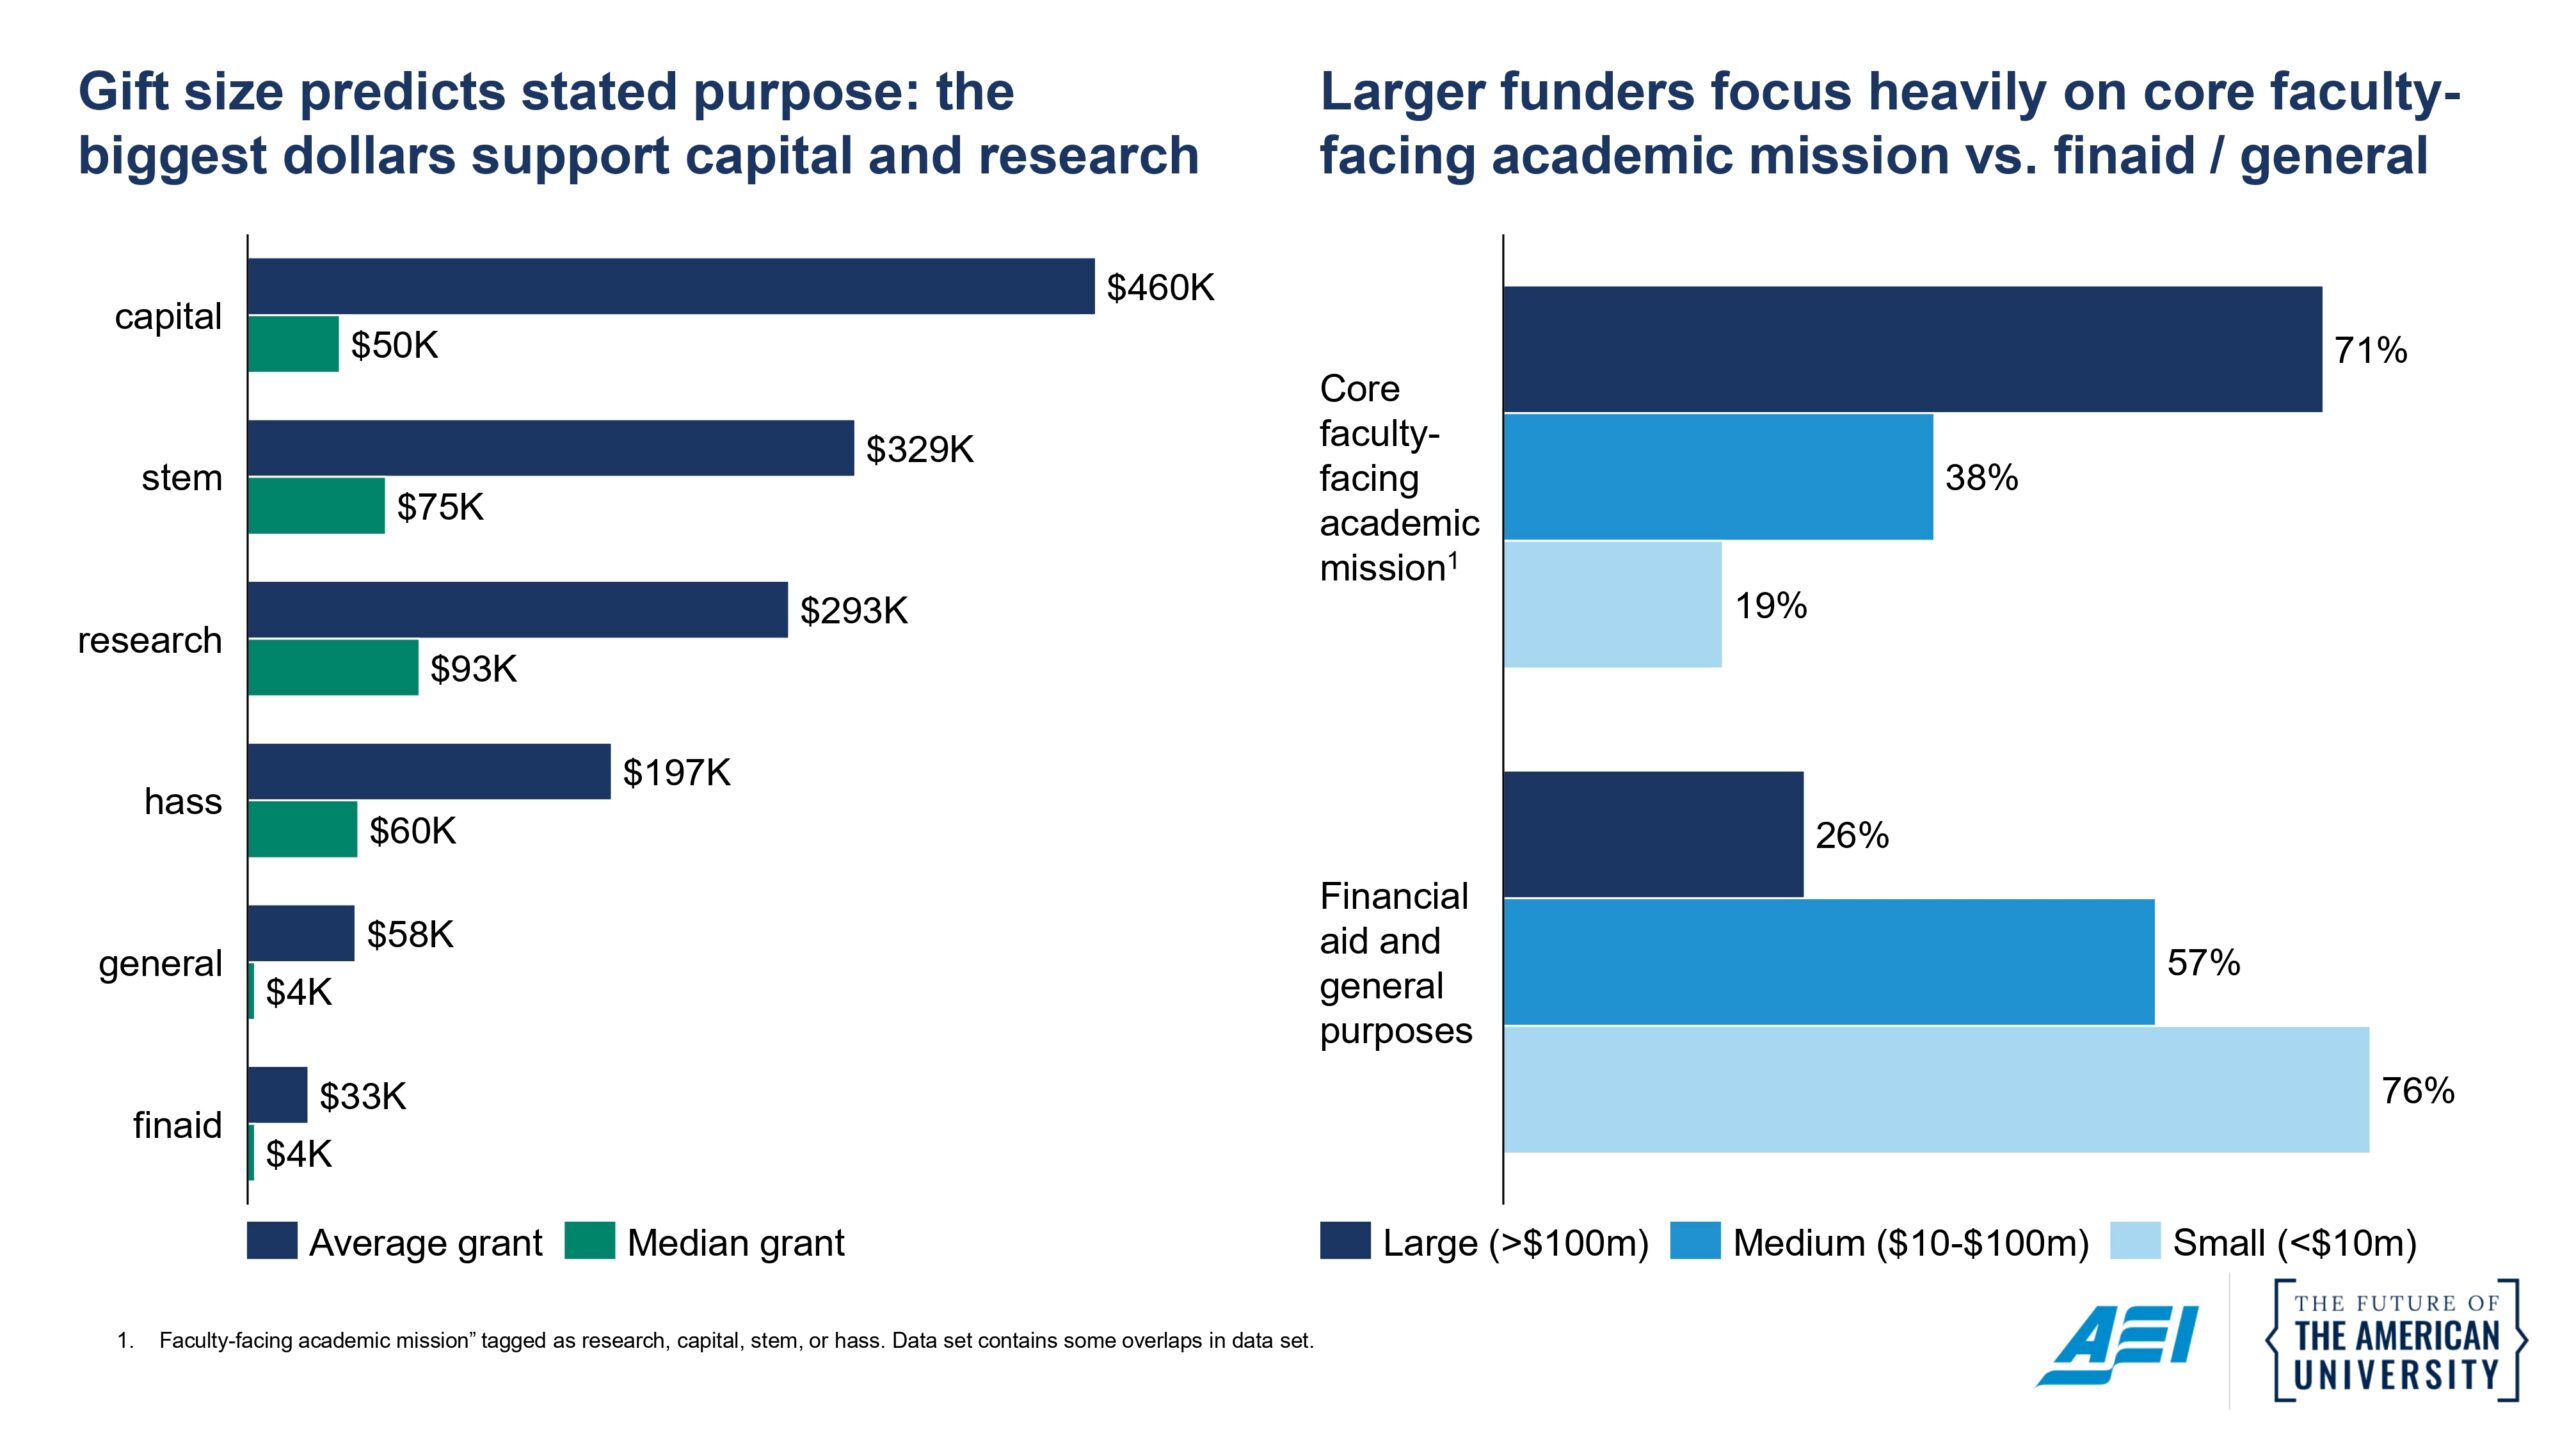
The median research grant is $93,000; the median grant for a building or laboratory carries the largest average of any category, $460,000. At the other end, the median scholarship or general operating grant is $4,000. The biggest checks buy research, science, and buildings; the smallest buy financial aid and general support.
Funders seem to follow this same pattern. The largest, each giving more than $100 million over the data set’s scope, allocated 71% of their money into the core faculty-facing academic mission (research, capital, STEM, or HASS), and only 26% into more fungible purposes such as student financial aid or general purposes. Meanwhile, the tens of thousands of small foundations, each giving under $10 million, are almost the exact inverse. They allocated 19% of their grants into the core faculty-facing academic mission, and 76% into financial aid and general purposes. There is a clear pattern on the long tail: the mega-funders support research and science, the smaller funders support financial aid and help keep the lights on.
Transparency is stable, but dropping among the largest funders
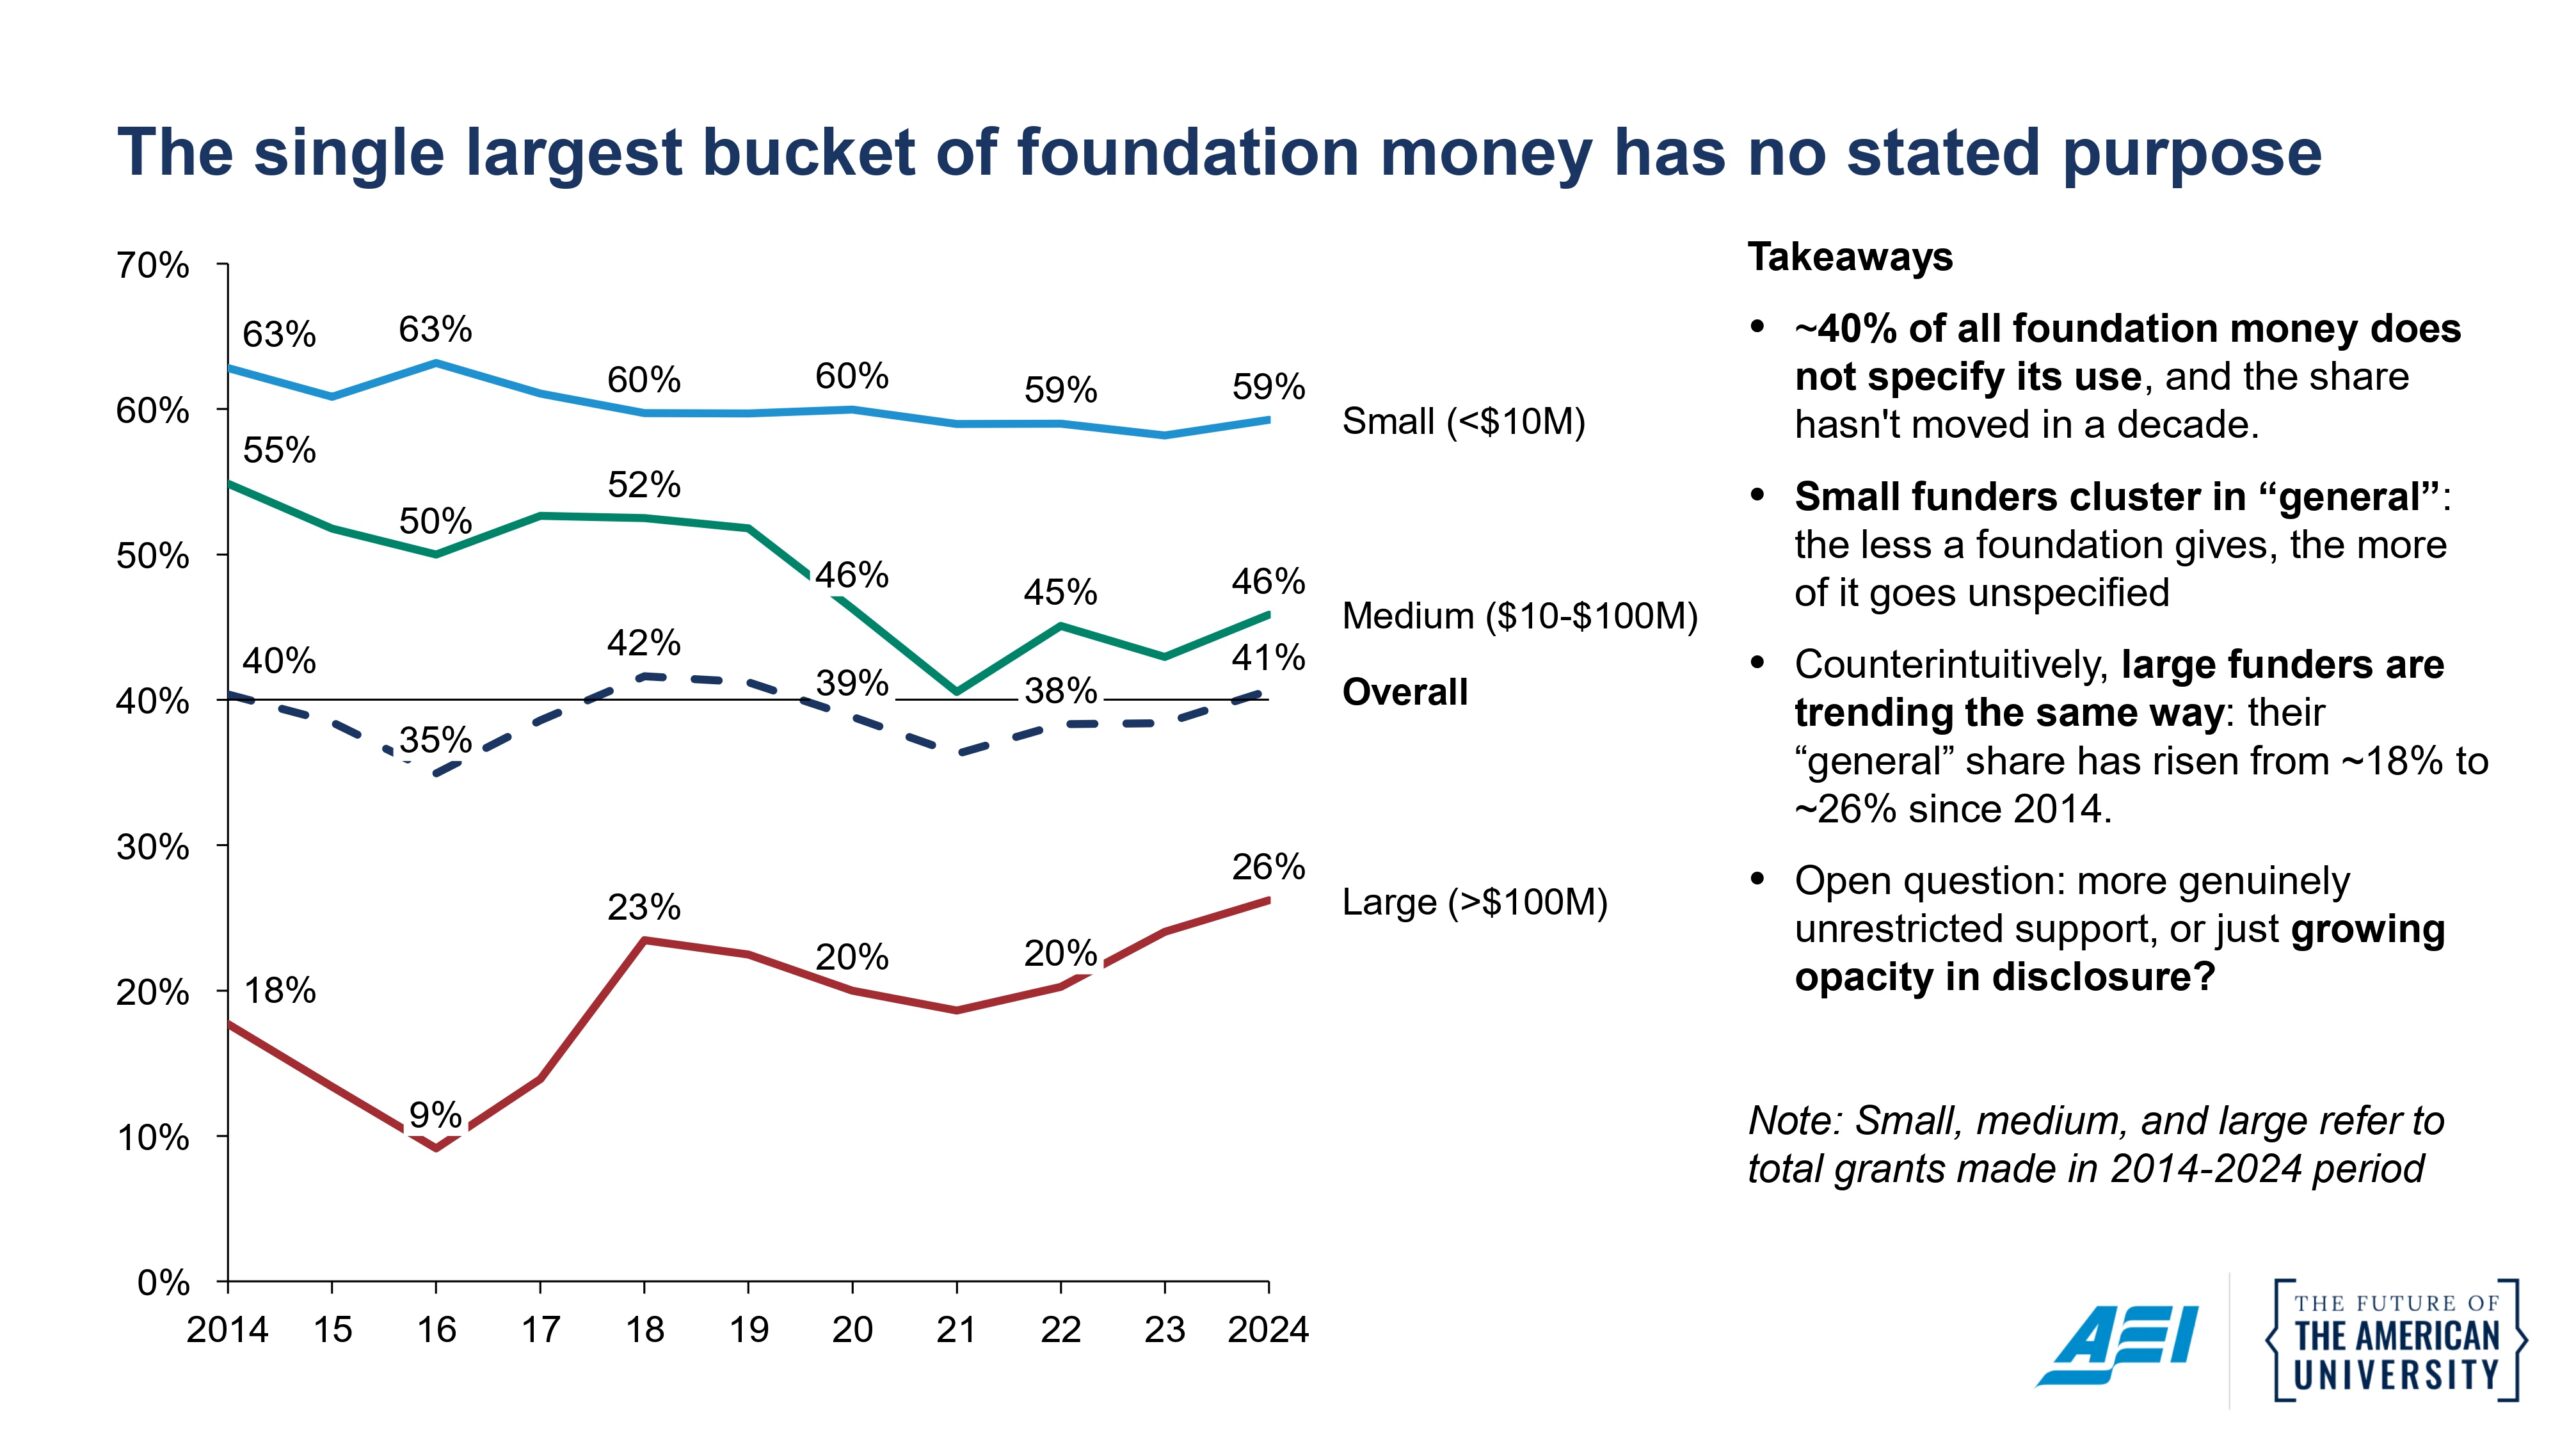
The single largest category of foundation money is money with no stated purpose. Overall, about 40% of all the dollars are tagged general, meaning the foundation’s own description names no specific purpose. This share has not moved in over a decade.
The smaller the funder, the more likely the grants are tagged as general. But the share of grants tagged as general from the largest funders (>$100 million in grants in the 2014-2024 period) has increased over the past decade.
To be sure, this does not necessarily mean it is truly unrestricted giving; it simply means the foundation has elected not to provide details on the grant in its tax filings. For example, Mellon describes each of its grants in detail, such as $500,000 in grants to the University of Massachusetts-Amherst for a “fellows program in decolonial global studies.” Meanwhile, the Charles Koch Foundation describes nearly all of its grants as simply “educational programs” or “general operating support.” Indeed, the release of SOURCE may have the unfortunate unintended consequence of encouraging foundations to be more circumspect in their public filings going forward.
Questions worth asking
The structure this data reveals raises many questions. A short list of foundations now underwrites much of the private foundation funding for research, science, and labs—the faculty-facing side of the academic mission. Some of these patrons are finite. The Gates Foundation has committed to spend itself out of existence within two decades. Others, Ford and Mellon among them, were built to last, accountable to no electorate and no shareholders, funding themselves in perpetuity from their own returns. It is worth asking what it means for entire disciplines to rest, indefinitely, on the preferences of a handful of institutions that answer largely to themselves.
And this is only the half we can see. SOURCE captures the U.S. private foundations that must file with the IRS. The other half of private support—gifts from individuals, philanthropic LLCs, and foreign funding—carries no disclosure obligation. Opacity is growing rather than shrinking. The patterns documented here are the patterns of the transparent half. How the darker half looks is the obvious next question, and the harder one to answer.
For university leaders, foundation money remains a small slice of the budget. But extreme concentration is a reality. The past year has shown how quickly concentrated federal funds can be disrupted, and what this costs an institution that assumed it would always flow. The same logic governs private money. The question for university leaders is how to balance the risks and rewards of concentration versus diversification. With SOURCE, leaders and supporters of these institutions can now see the shape of what sustains them.
Technical appendix
A full technical appendix can be found in this GitHub repository with code and methodologies to reproduce or further extend this data set.
Tao Tan